In the current data-centric environment, organizations are bombarded with an immense volume of information every day. However, possessing data does not automatically equate to success. Without effective analysis and interpretation, data can devolve into mere noise. For decision-makers, the real challenge is not the accumulation of more data, but rather the extraction of the right insights at the right time. This is where business analytics tools become essential—converting extensive datasets into actionable insights. At Raven Labs, we specialize in crafting custom analytics solutions that dismantle data silos, deliver real-time insights, and forecast trends, paving a clear and strategic path forward.
The Problem: From Data Silos to Unified Systems
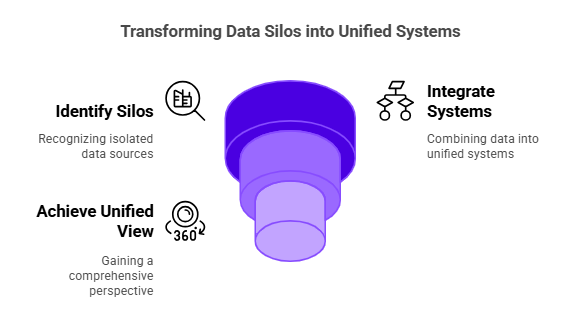
A major hurdle that businesses encounter is the presence of fragmented systems. Departments such as sales, operations, finance, and marketing often function in isolation, each generating its own data. This fragmentation makes it nearly impossible to achieve a comprehensive view or make informed decisions.
Why This Matters:
- A lack of unified data hinders decision-makers from spotting inefficiencies or trends across departments.
- Solely depending on historical data does not equip businesses for future challenges.
- Real-time insights are crucial in fast-paced industries where quick decisions are vital for success.
The Solution: Tailored Dashboards for Industry, Function, and Role
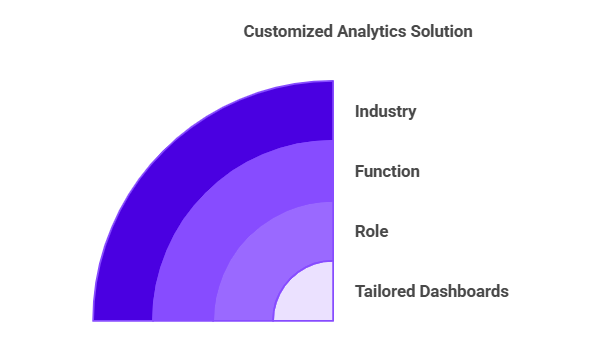
At Raven Labs, we assert that analytics should be customized to meet your specific needs. By merging data from isolated systems into bespoke dashboards, we provide a 360-degree view of your business, tailored to your industry, function, and role.
1. Industry-Specific Dashboards
Every industry has unique metrics that drive success.
- Manufacturing: Track production rates, equipment performance, and inventory turnover.
- Retail: Monitor sales by location, customer demographics, and seasonal trends.
- Construction: Oversee project timelines, budget variances, and contractor performance.
Example: A manufacturing client utilized Raven Labs’ dashboards to monitor real-time production efficiency, identifying bottlenecks that led to a 20% improvement in throughput and reduced downtime.
2. Function-Based Dashboards
Functional teams require analytics tailored to their specific responsibilities.
- Sales: Monitor pipeline health, conversion rates, and deal velocity.
- Finance: Track cash flow, P&L performance, and budget adherence.
- Marketing: Assess campaign effectiveness, customer acquisition costs, and ROI.
Example: A sales team leveraging a Power BI dashboard from Raven Labs enhanced their win rates by 15% by pinpointing where deals were stalling.
3. Role-Based Dashboards
Different roles necessitate tailored perspectives of the same data.
- CEO Dashboard: High-level KPIs across departments with year-over-year comparisons and forecasts.
- CFO Dashboard: Real-time insights into cash flow, expense tracking, and profitability.
- Operations Manager: Live updates on resource utilization, project progress, and cost overruns.
Example: A CFO at a retail chain employed a custom dashboard to identify rising operational costs in specific locations, facilitating a 10% reduction in overhead expenses.
Key Features of Custom Dashboards
Our dashboards are designed to deliver real-time, actionable insights with the following capabilities:
- Real-Time Metrics: Monitor performance as it occurs, from sales conversions to operational efficiency—eliminating the wait for monthly reports.
- Alerts and Notifications: Custom alerts notify teams about critical changes, such as cost overruns, low inventory, or missed deadlines.
- Historical Comparisons: Track performance trends over time and identify patterns by comparing current performance to historical benchmarks.
- Predictive Insights: Utilize historical data to generate forecasts, aiding leaders in anticipating challenges and opportunities.
- Actionable Recommendations: Dashboards do more than display data—they translate it into insights and recommendations for improved decision-making.
Why Real-Time Analytics Matter
Real-time analytics empower businesses to:
- React Quickly: Address issues like stockouts or delays before they escalate.
- Identify Opportunities: Spot emerging trends and adjust strategies to maximize gains.
- Stay Competitive: In industries where timing is critical, being proactive provides a significant advantage.
Stat: According to McKinsey, companies leveraging real-time analytics are 20% more likely to outperform their competitors.
Breaking Down Silos for a Complete Picture
Disconnected systems lead to inefficiencies and missed opportunities. By integrating all data sources—from CRM and ERP platforms to marketing and operations software—businesses can:
- Eliminate redundancies and manual work.
- Achieve a holistic view of performance.
- Align departments to reach shared objectives.
Raven Labs’ Custom Dashboard Solutions
At Raven Labs, we offer unparalleled expertise in business intelligence tools like Power BI, Zoho Analytics, and bespoke development. Our solutions are tailored to your industry, function, and role, providing the insights necessary for success.
Why Choose Raven Labs?
- Industry Expertise: In-depth understanding of challenges across sectors such as retail, manufacturing, and construction.
- Customized Solutions: Tailor-made dashboards designed specifically for your business needs.
- Integration Experts: Seamlessly merge data from fragmented systems.
- Actionable Insights: Move beyond raw data to trends, forecasts, and AI-powered recommendations.
Case Study: A Retail Chain’s Analytics Transformation
The Challenge:
A prominent retail chain faced difficulties due to segregated systems for sales, inventory, and marketing. Decision-makers relied on outdated reports, leading to delayed actions.
The Solution:
Raven Labs created a custom Power BI dashboard that integrated all systems:
- Real-time sales data by location.
- Inventory levels and turnover rates.
- Marketing performance linked to both in-store and online sales.
The Results:
- Increased Sales: Insights into high-performing products led to a 15% revenue boost.
- Optimized Inventory: Overstocking decreased by 20%, saving thousands in storage costs.
- Improved ROI: Marketing budgets were redirected to high-performing campaigns, resulting in a 25% increase in ROI.
Analytics: A Business Imperative
In today’s fast-paced markets, businesses must:
- Monitor real-time performance to stay ahead.
- Break down silos for a comprehensive operational view.
- Forecast trends to anticipate opportunities and risks.
With Raven Labs’ custom dashboards, you can transcend data overload and harness insights to drive smarter, faster decisions.
Contact Us:
- 📞 Call: +61 432 913 392
- 📧 Email: info@ravenlabs.com.au
- 🌐 Visit: [ravenlabs.com.au](http://ravenlabs.com.au)
Let Raven Labs assist you in transforming your data into actionable insights.